Graphviz - Making Super Cool Graphs
At work there is a long lab exercise that was responsible to go through - double check the instructions, look at the boiled plate code, check the solution and run it on our lab machines. It was in amazing shape thanks to Ally, a co-worker, who cleaned it last cohort. So I thought about what I could add this this exercise and after talking to Kara, another coworker, we came up with making a visual! This lab is where students have multiple routes that they create that do different things based on the their user data flow - prior labs were 'simple' with two or three routes that didn't really interact. So I thought that it would be helpful to add some images of how the '/register' route should render a html page that contains a form that does a post request to that same route and redirects to the home route.Example of a homepage: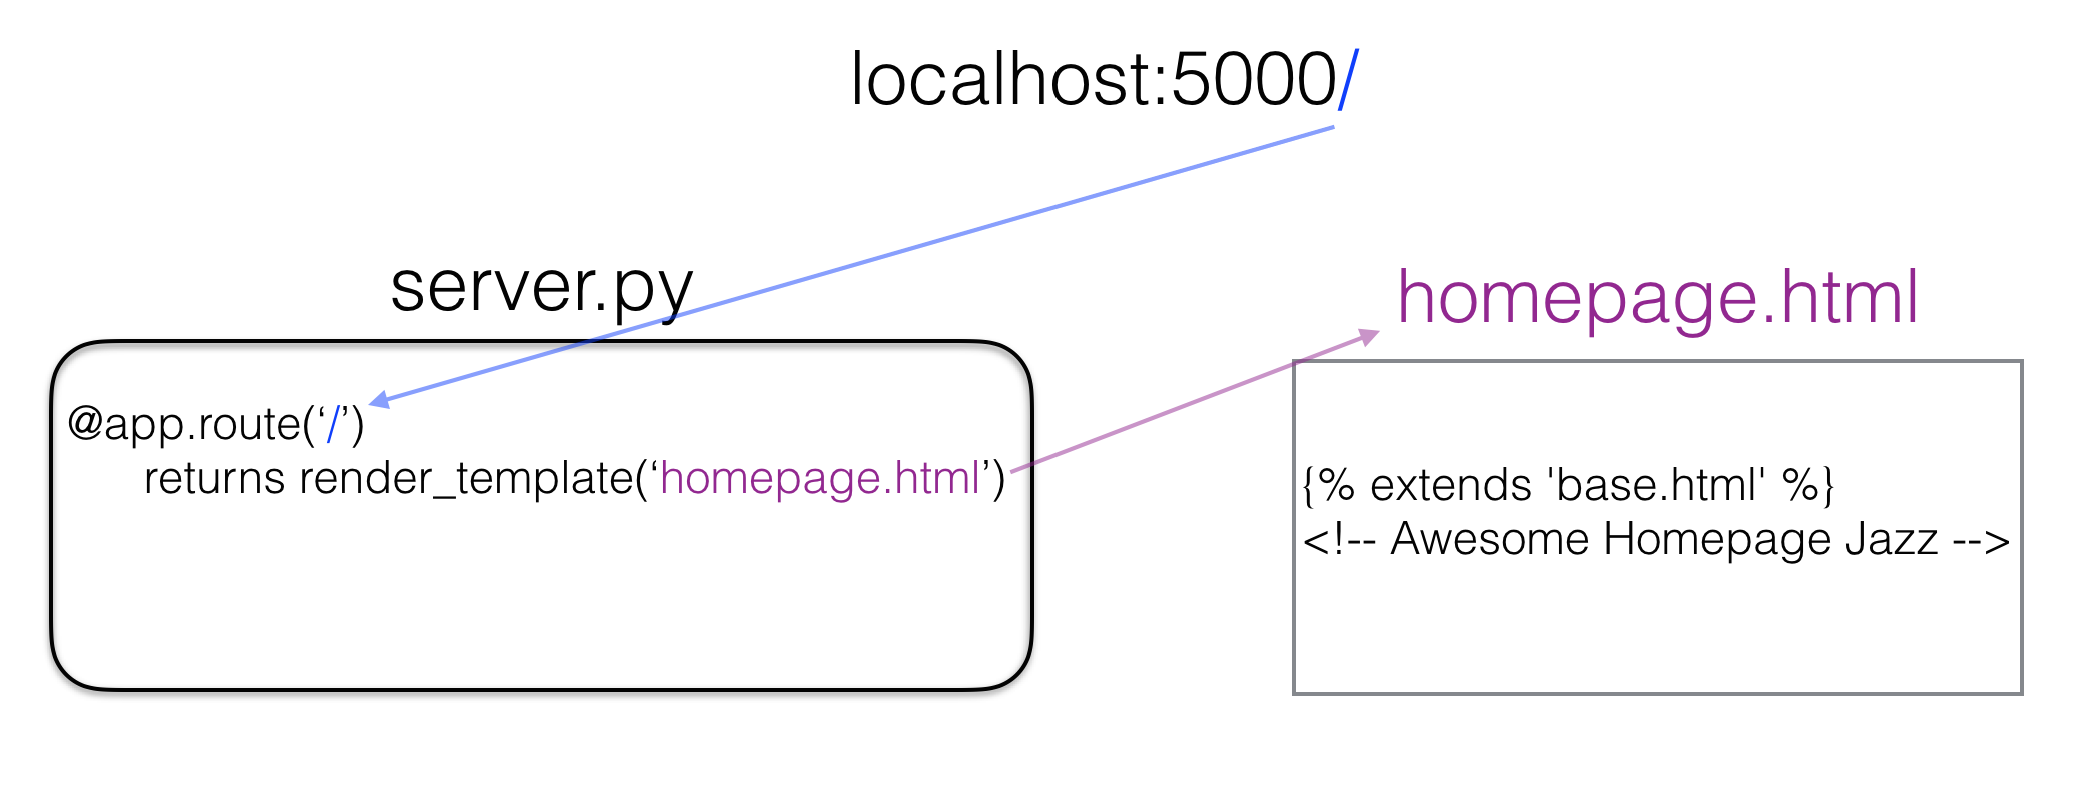 Example of registering:
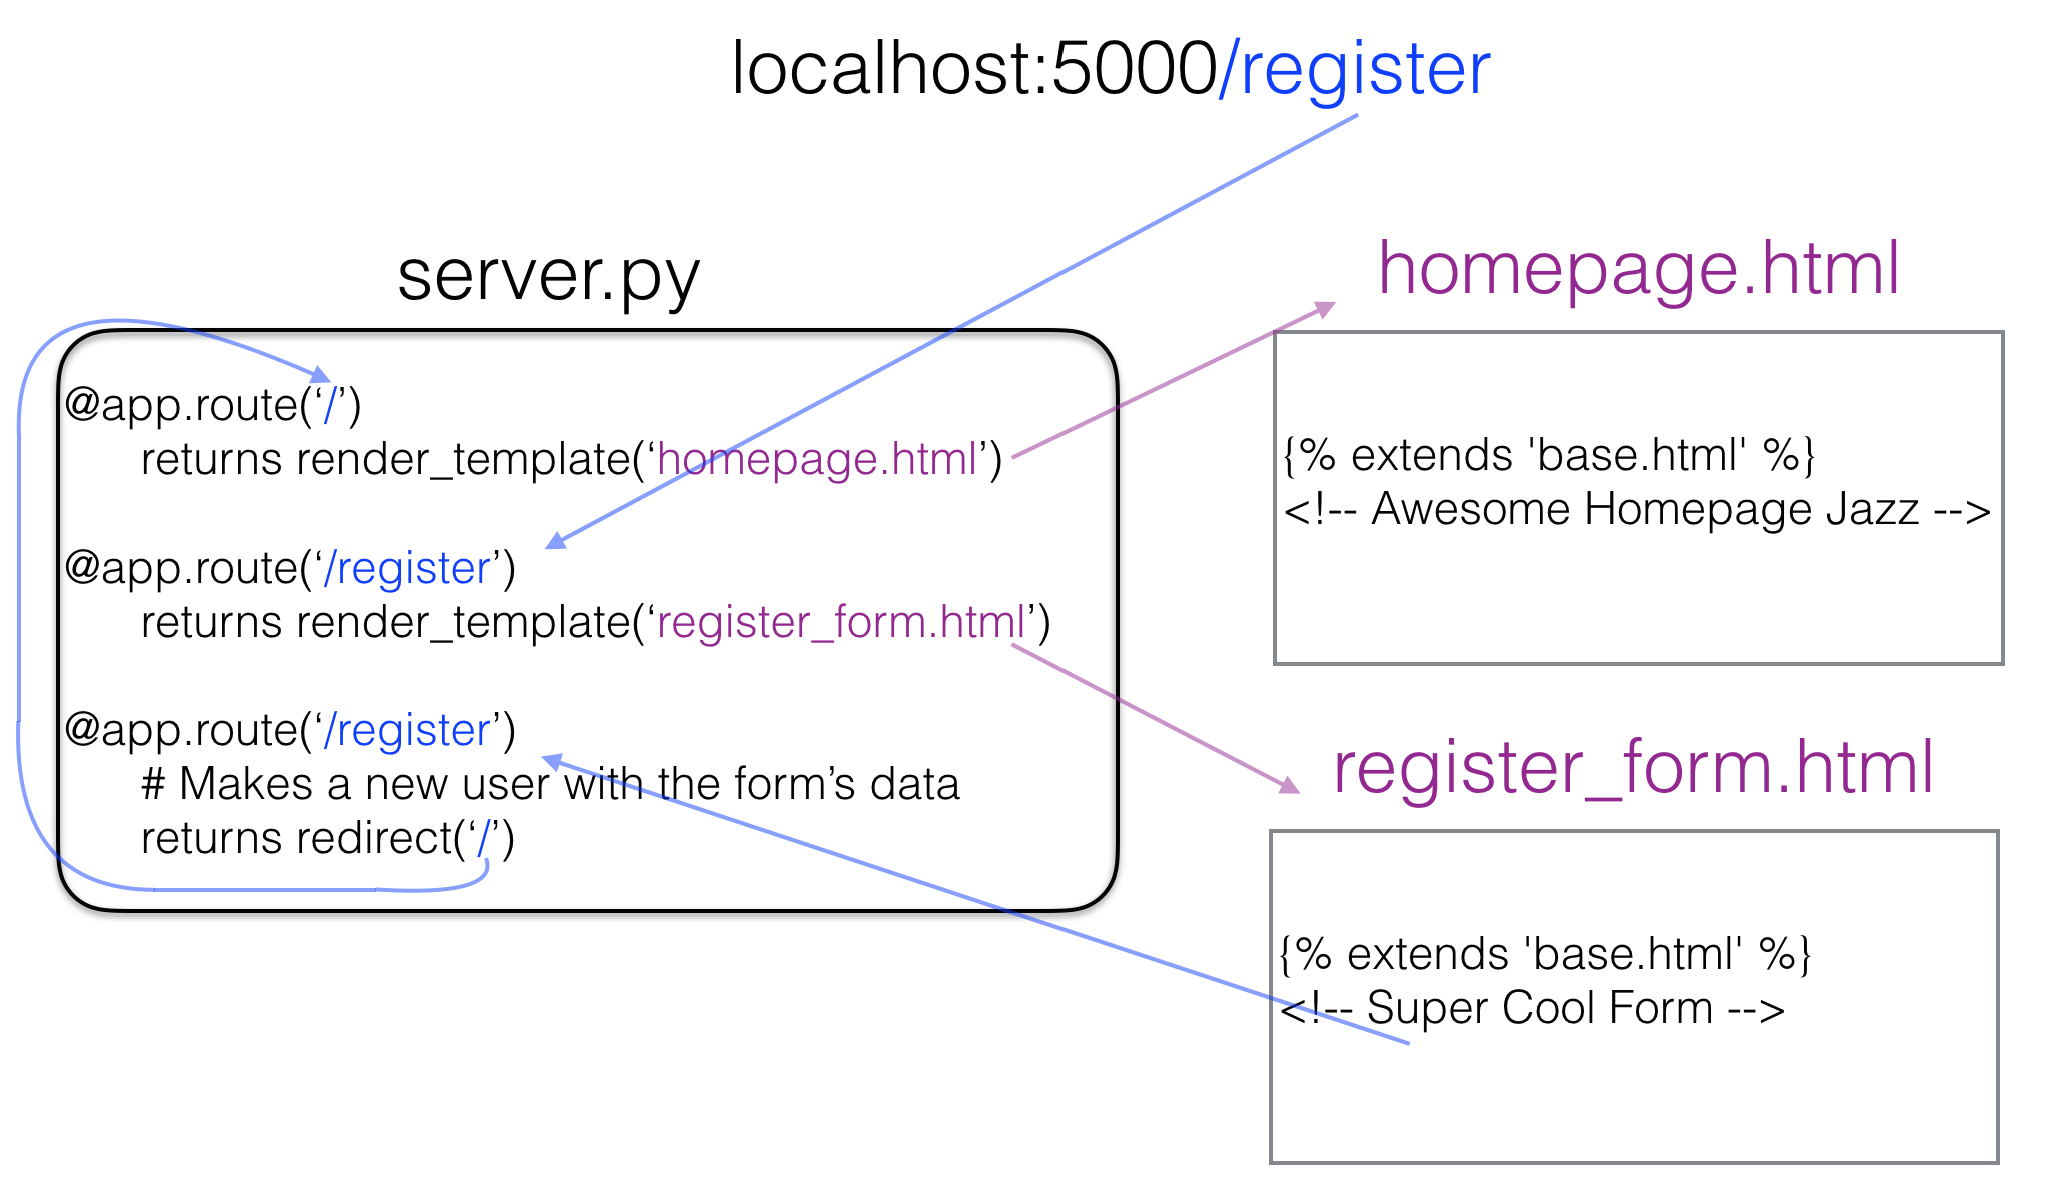 My coworkers loved it! My boss loved it too! ---BUT ---he shared with me that we are not adding more images to our repo because the maintenance and space. He shared that he would like for me to do this in graphviz. Which is an open source graph visualization software that represents structural information as diagrams of abstract graphs and networks --eeek!So I started with example code from another lecture -- which was helpful but not helpful at the same time. --- You know when you don't have enough knowledge on a topic that examples are not as helpful, so its a little frustrating that you don't know how or why things work???So instead of just trying to read it to understand(or check out youtube for some tutorial videos), I changed a part and then rendered it to see what happens. It did this a couple of times to see what effects the code had and I was able to to start drawing out what I want. Instead of doing a the visual for three routes and two client views, I did one route and one client. I knew that I would need two things that point to different parts -- it couldn't just point from any part of the server to the browser nor any part of the client to the server. I googled the different shapes that graphvis can do, which are several, and thought that the server should be a table and the client could possibly be a node (square). So I build a table and I pointed it to a browser that hasn't been defined just named.[code language="text"]server [shape=plaintext label=<<TABLE BORDER="3" CELLBORDER="1" CELLSPACING="0" CELLPADDING="7"><TR><TD PORT="f0"><FONT COLOR="black">Server/Flask</FONT></TD></TR></TABLE>>]browser -> server;server ->browser;[/code]
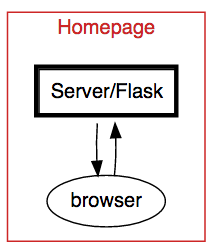 Nice! Now its a matter of giving the server a sense of a route. I did this by giving the table a <TR> (for table row) and a <TD> ( table details). Awesome, my Server as a route. But this looks weird. I want them side by side.
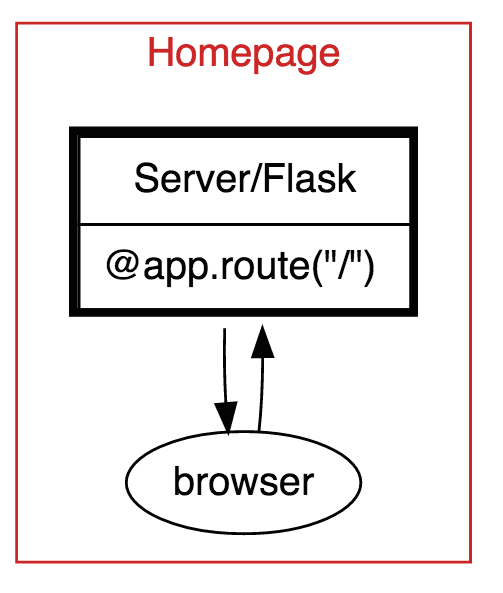 To change the logic where the nodes go from Top to Bottom to Left to Right, I had to change:[code language="text"]rankdir=LR;[/code]
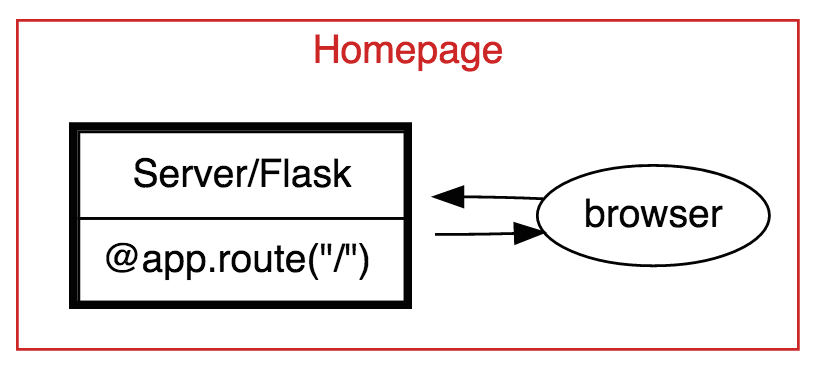 So now I have a server with a route that is pointing to a sad simple browser blob. I decided to combine the original localhost:5000/ along with the html so the Client makes the request and receives a response. I mimic the server and I made the browser into a table with localhost:5000/ and the homepage.html
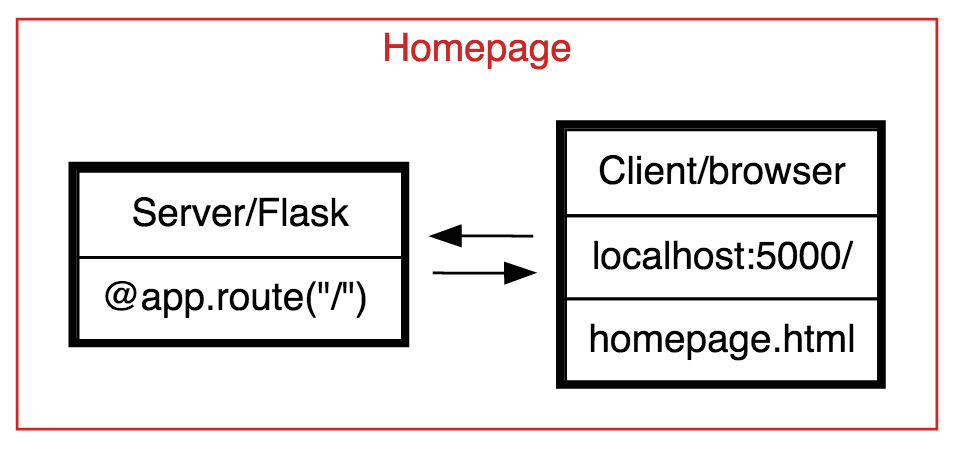 To make the pointing meaningful (not just pointing the whole table to the other whole table) I added ports to each TD, that gives me the ability to point browser:f1 -> server:f1 Nice![code language="text"]browser:f1 -> server:f1;[/code]
 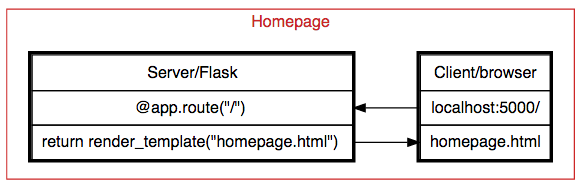 Now that I have a lot of the components, its a matter of styling. I changed the color on the TD for @app.route to red and I made the TD for @app.route & return render_template text align to the left -- that way the text looks similar to a python flask routes. I also flipped the order so its Client on the left and Server on the right by creating the client table first and then the server in the code and I put a label on the arrow.[code language="text"]server [shape=plaintext label=<<TABLE BORDER="3" CELLBORDER="1" CELLSPACING="0" CELLPADDING="7"><TR><TD PORT="f0"><FONT COLOR="black">Server/Flask</FONT></TD></TR><TR><TD PORT="f1" BORDER="0" ALIGN="LEFT"><FONT COLOR="red">@app.route("/") </FONT></TD></TR><TR><TD PORT="f1b" BORDER="0" ALIGN="LEFT"><FONT COLOR="black"> return render_template("homepage.html")</FONT></TD></TR></TABLE>>][/code]
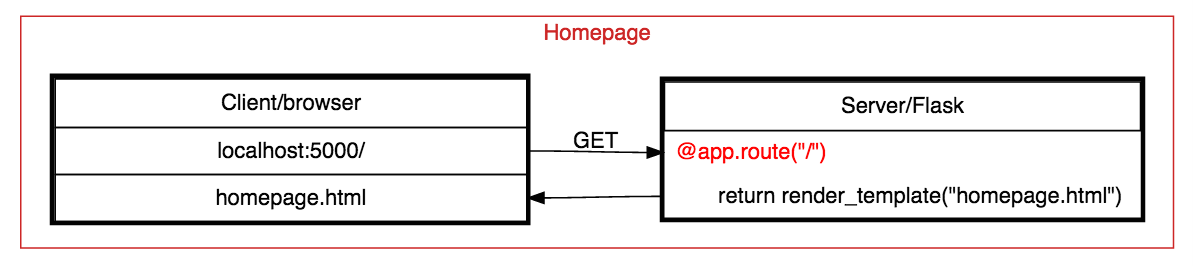 I applied these concepts to the '/register' example to make this beauty!
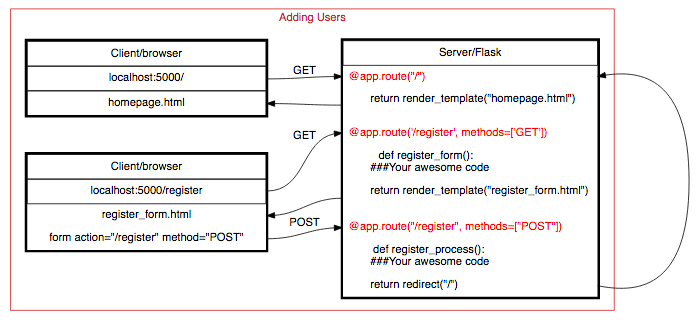
DevelopHerDevelopHim has a video of a step-by-step on how to make a fun graph of doctor who!